How to interpret digester behaviour using graphs and data?
The pattern of the plot denotes the different behaviours of the system. The graph can give you valuable insights, as explained below. We are also working on automating some of these insights.
Good use and system performance
Based on the size of the digester, a user should feed and consume the gas appropriately. This will help them get the most out of the digester. Every digester has the capacity to hold slurry and gas and this decides the amount of feed and total gas it can generate and store. If a user feeds too little into the digester it will not create enough gas and it will not work at its full capacity. If a user feeds too much amount and the digester can’t hold that much gas it will vent into the environment.
Each Smart Biogas device has a Pressure Sensor that tells you about the amount of gas present in the digester. Thes pressure decreases when the gas is consumed and increases when gas is generated.
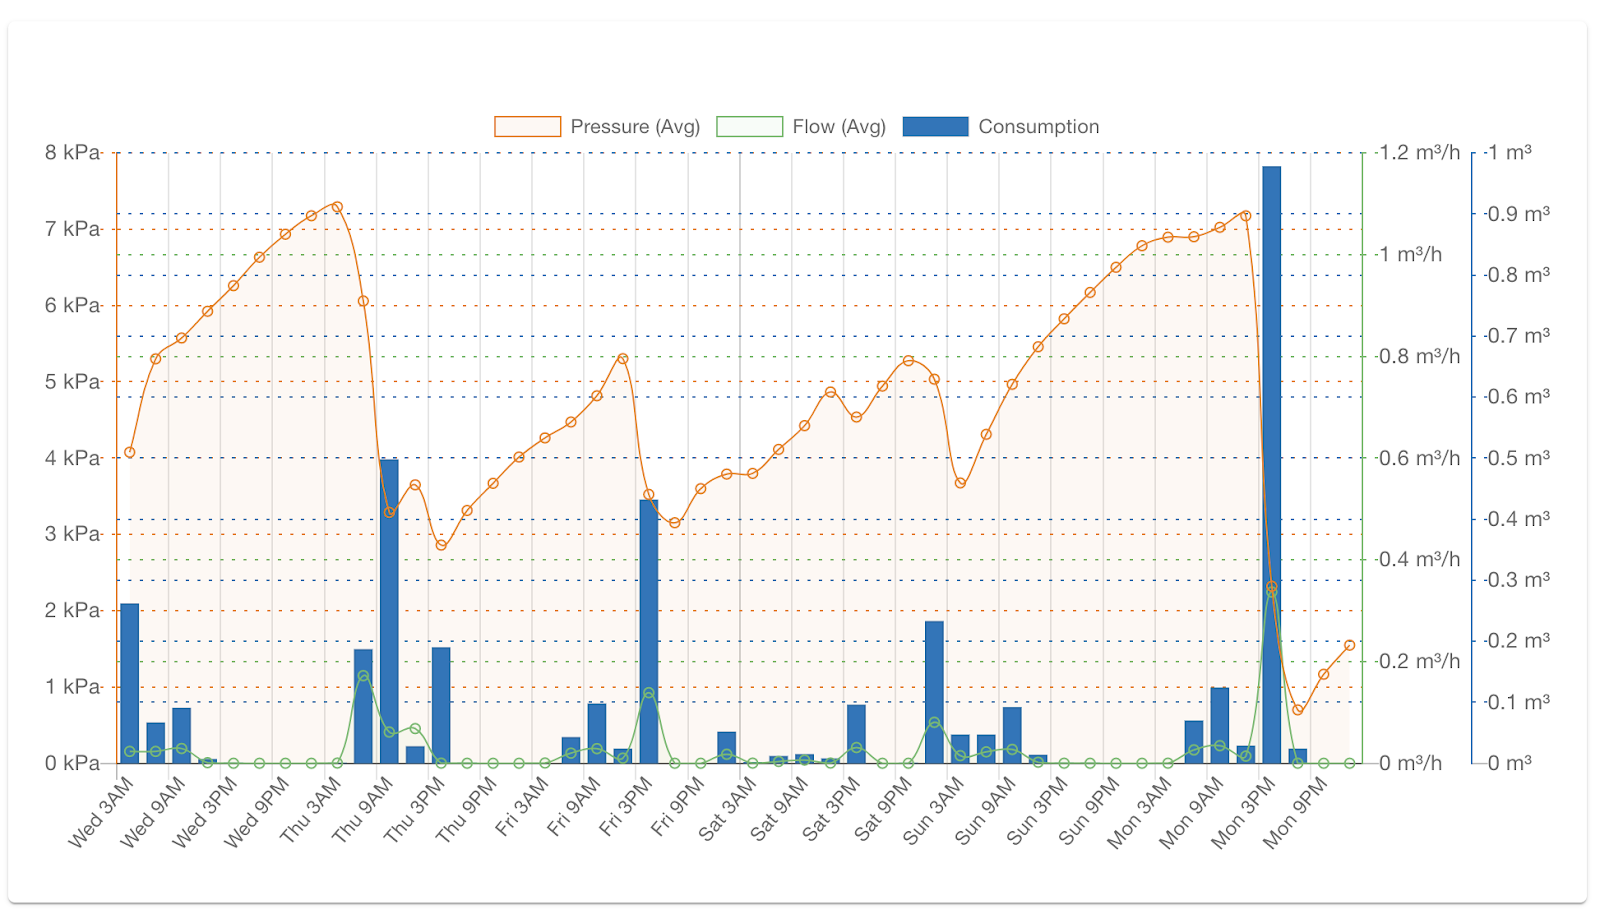
On the graph, you can see if there is continuous production when the gas produced reaches the maximum and if it is being used regularly. These patterns are easier to spot on some types of digesters over others, the example below is from a fixed dome digester which shows pronounced increases and decreases in pressure.
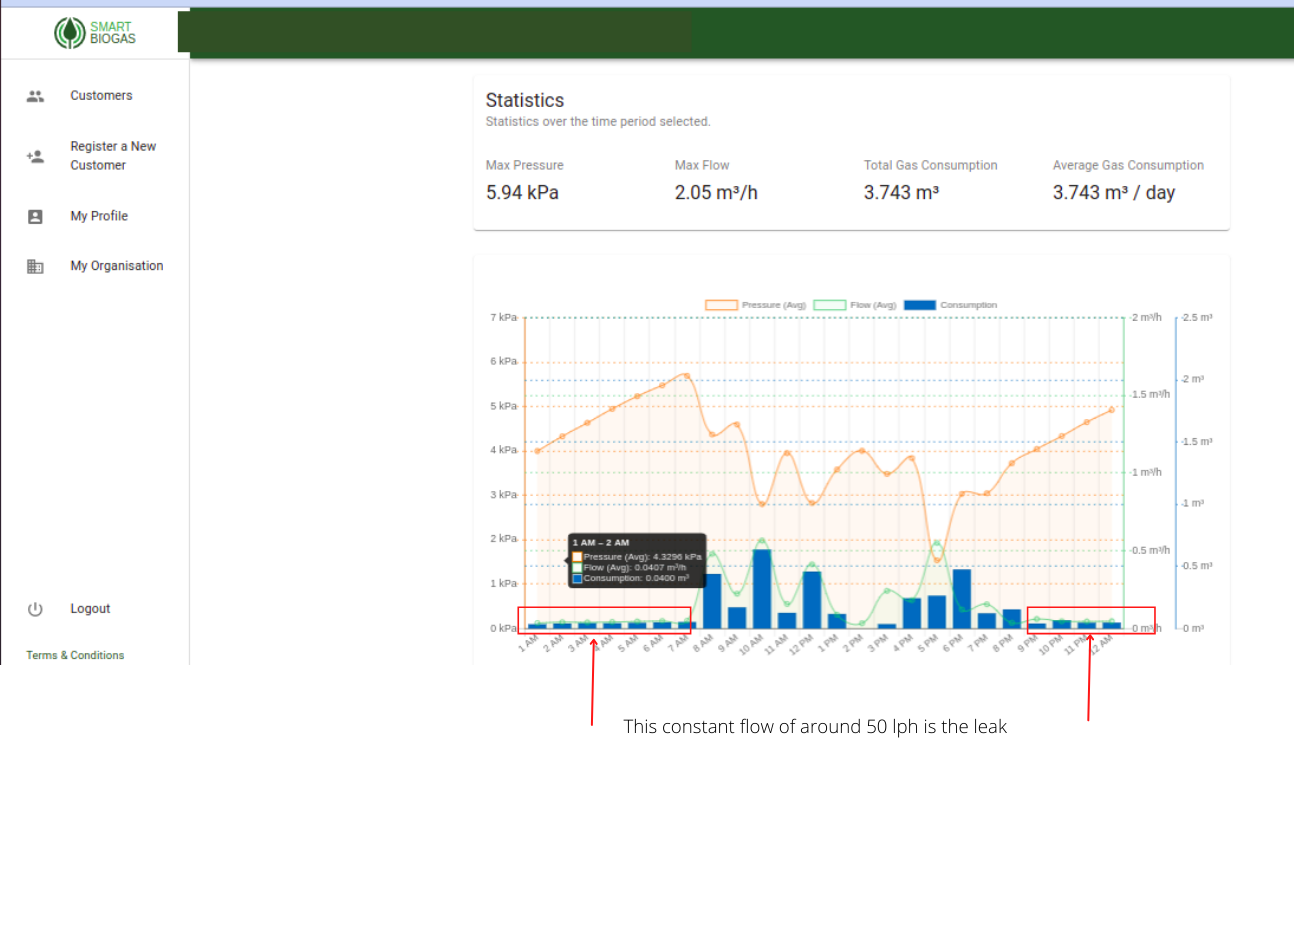
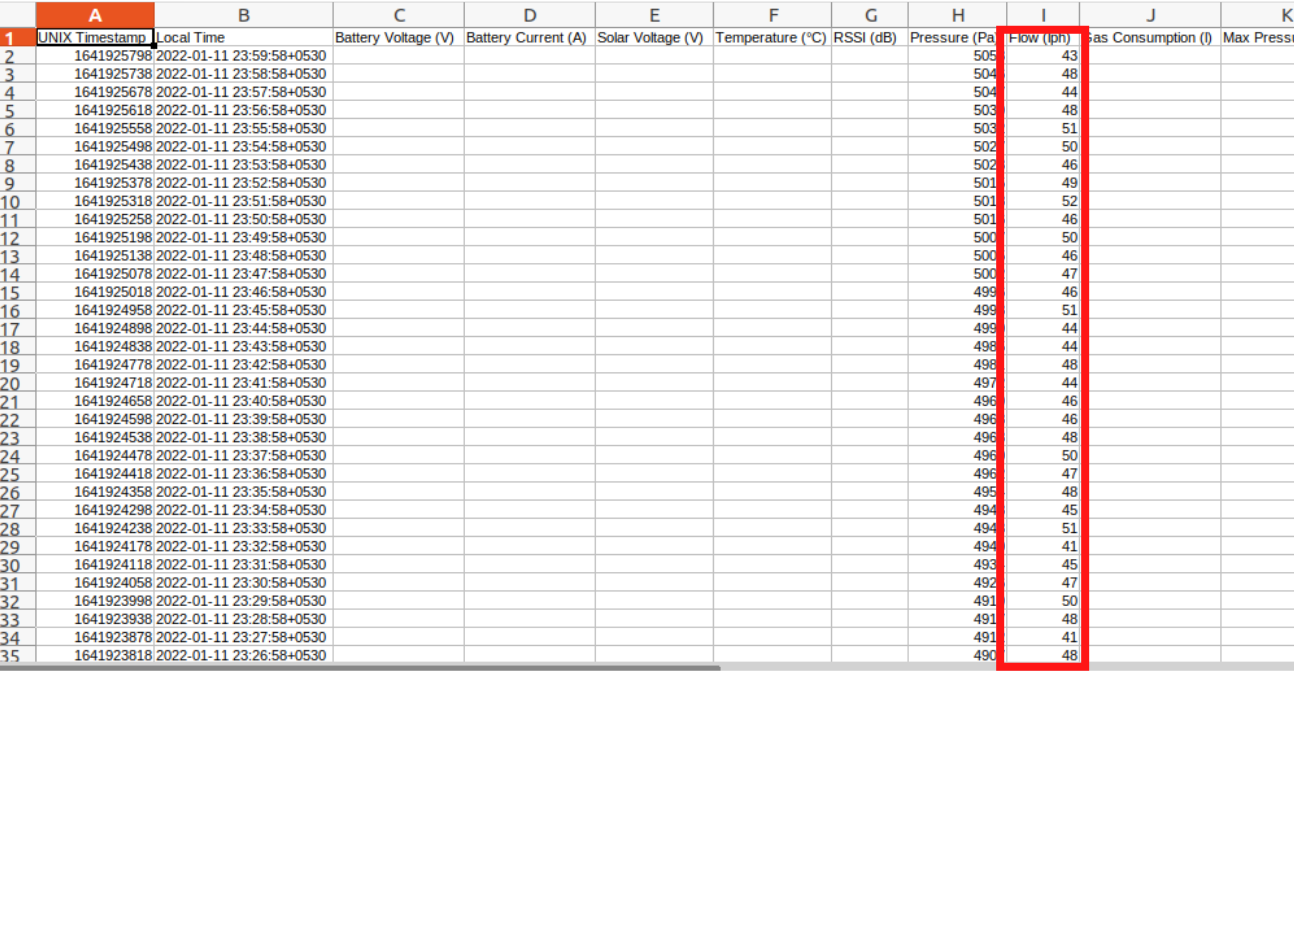
Gas can leak due to improper fitting of pipes, leaks at the gas valve, or leaks at the burner. Without a meter in place, gas leaks are usually not tracked or detected because of the relatively low flow. The Smart Biogas sensors can detect any low flow value and as you can see in the graph, any flow value between 20-100 lph or .02- .1 m3/hr can be a leak.
Venting
Once a digester’s gas chamber is full, additional gas produced by the digester is vented into the environment and wasted. A user may feed too much and not use the gas, or the digester may be too large and the feed is more than the amount of gas used.
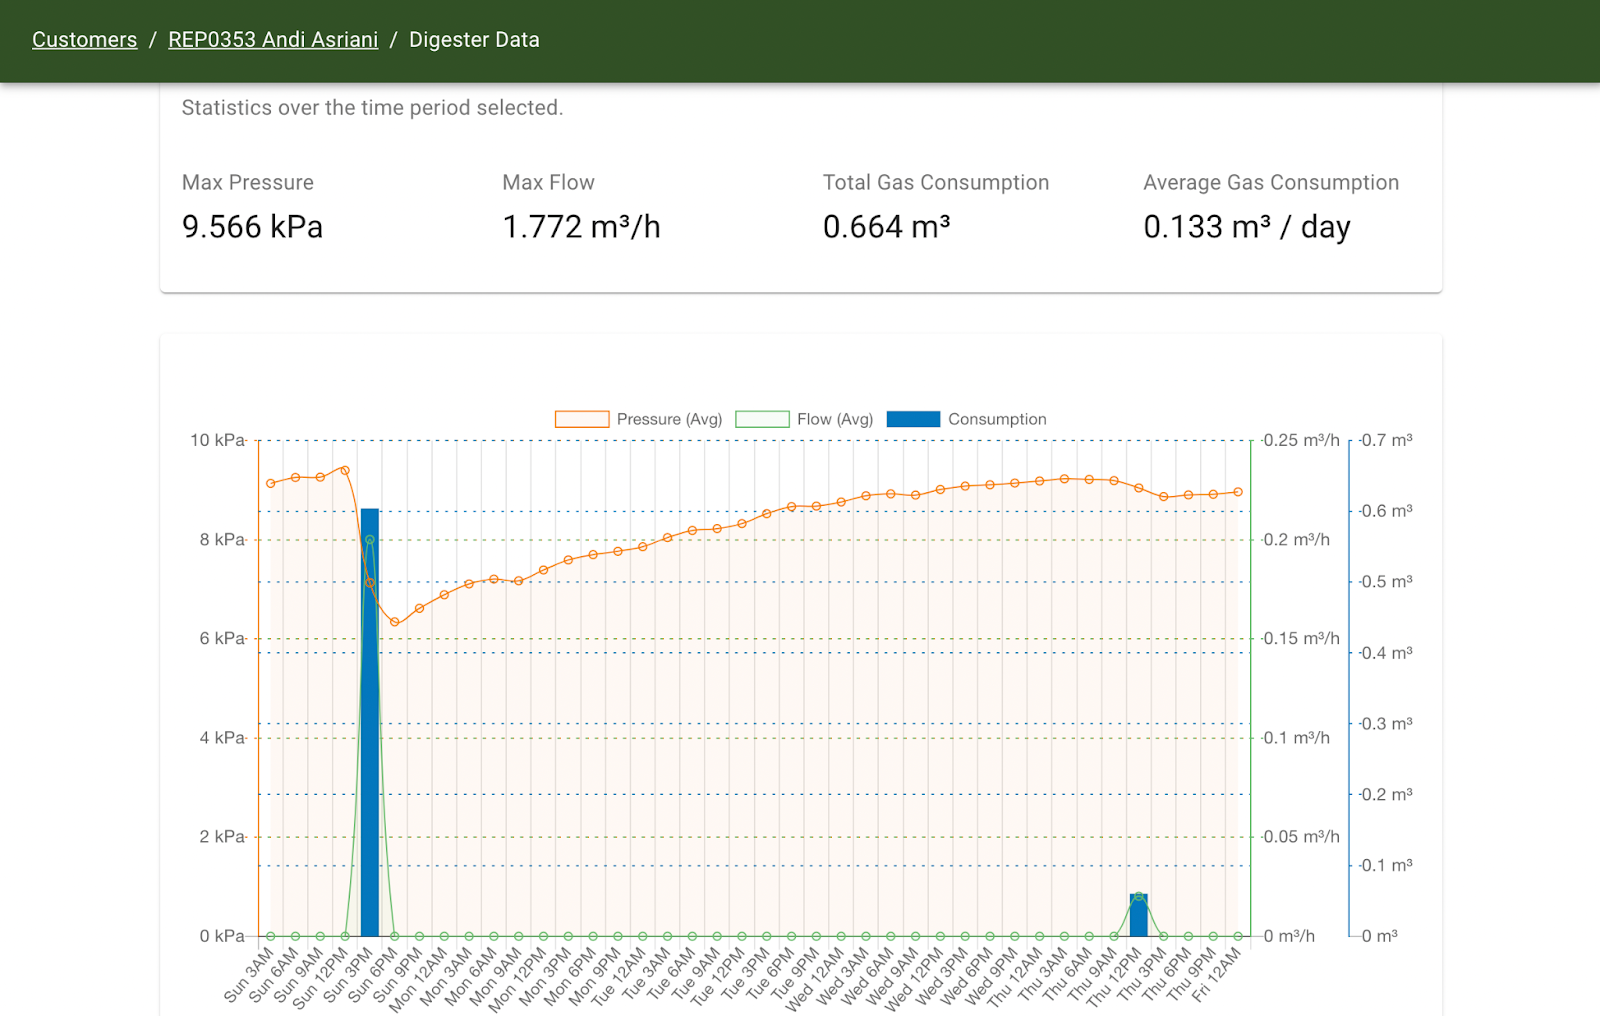
With the Pressure sensor on the Smart Biogas device, venting can be detected. On the graph, the Pressure values are stable at maximum, such as that shown towards the right-hand side of the example below.
Related Articles
Viewing Data & Stove Temperature Sensor Reports on Smart Biogas Portal
1. Accessing Data To view system data on the Smart Biogas Portal: Log in to the Smart Biogas web application Open the System Details page Navigate to the “Data” section 2. Data Visualization Graphs are displayed below the smart meter data Each stove ...Data Policy
Who owns the data, and what are data privacy policies? Although Inclusive Energy manages the data on our cloud server, you are the owner of the data as a biogas company. In that respect, you are therefore responsible for the substantive accuracy of ...Understanding Stove Temperature Data
Temperature Threshold Above 50°C = Active data logging Below 50°C = No activity Cooking Sessions Start: Temperature rises above threshold and continues to rise or stays at a relatively stable temperature End: Temperature consistently drops ...How to Collect Data from Temperature Sensor
Required Tools Bespoke USB-C cable Android smartphone (Android 7+) Stove Temperature Sensor app Step 1: Connect Device Connect cable to phone and sensor Verify proper connection Step 2: Open App Launch Stove Temperature Sensor app Tap “Connect to ...Viewing a Biogas System and Its Data
To access detailed information, data, and analytics for a Biogas system, follow these steps: 1. Locate the Biogas System Navigate to the Systems tab. Use the search or filter options to find the specific system. Click on the system to open its ...